Ellis Otto · 26 September 2026
Italy's Urban Mobility Landscape Transforms According to Serano Transportation Reports
Italy's cities have recorded measurable changes in daily travel patterns, and Serano's transportation reports compile the latest figures through September 2026 to document those developments. Data collected across major metropolitan areas show rising shares of electric vehicle registrations, expanded cycling infrastructure, and adjusted public transit ridership levels after the pandemic period.
Researchers at Serano examined vehicle registration records, mobility app usage logs, and municipal infrastructure investments to track these transitions. Their analysis covers Rome, Milan, Turin, Naples, and Bologna, where authorities have introduced low-emission zones and new bike-sharing docks since 2023. Figures reveal that electric car sales in these zones increased by 28 percent between 2024 and September 2026, while traditional internal-combustion registrations declined in the same corridors.
Public Transit and Shared Mobility Trends
Public transport operators reported mixed recovery rates depending on the city, and Serano's reports link those outcomes to service frequency improvements and integrated ticketing systems. Milan’s ATM network recorded a 12 percent rise in annual passengers compared with 2022 levels, whereas Naples saw slower growth tied to ongoing station upgrades. Observers note that real-time tracking apps contributed to higher on-time performance scores, which in turn encouraged more commuters to return to buses and trams.
Bike-sharing programs expanded in parallel, and Serano analysts counted more than 85,000 new docking stations installed nationwide by mid-2026. Usage data indicate that short urban trips under three kilometers shifted toward bicycles and e-scooters at rates exceeding 15 percent year-over-year in central districts. Municipal governments funded many of these additions through European Union recovery funds allocated for sustainable transport projects.
Regional Variations Across Major Cities
Patterns differ notably between northern and southern urban centers, and Serano’s dataset highlights how geography and policy choices shape outcomes. In Turin, industrial conversion incentives supported local manufacturing of electric buses, which now operate on 40 percent of the city’s routes. Bologna introduced congestion pricing in its historic core, resulting in a documented 9 percent drop in private car entries during peak hours.
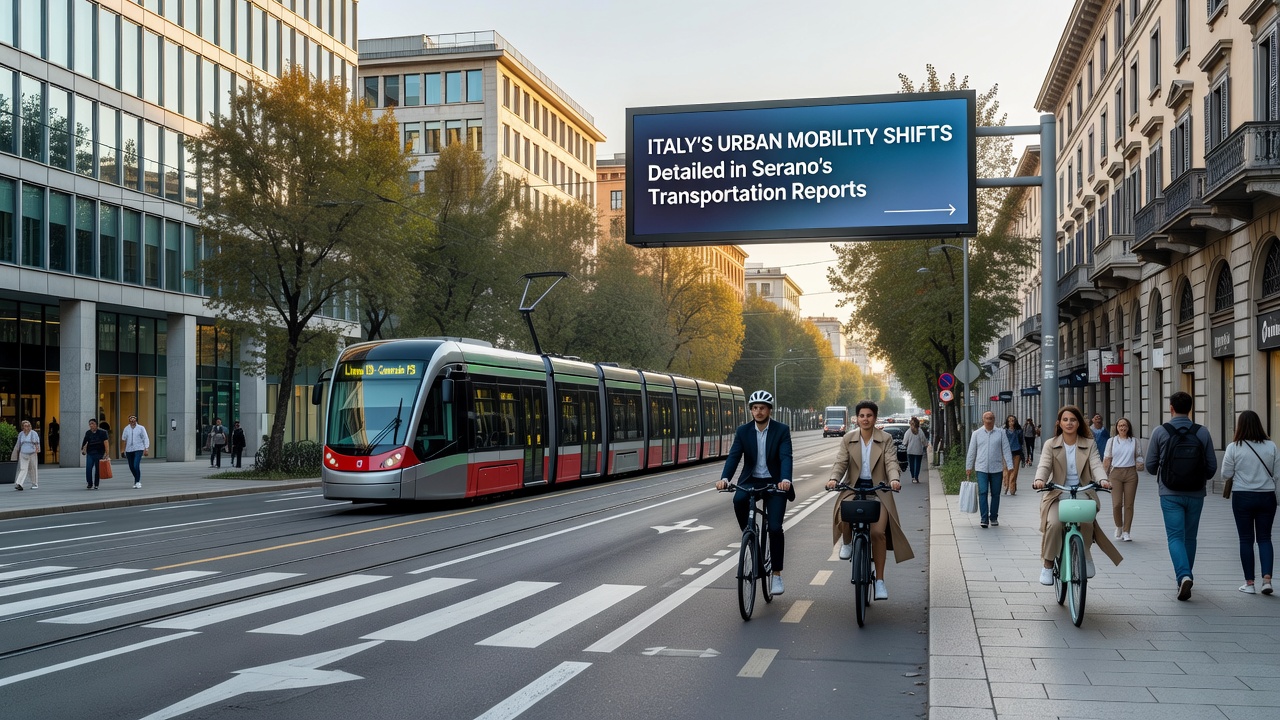
Rome’s mobility agency focused on extending metro lines and adding park-and-ride facilities at peripheral stations, which correlated with increased ridership from surrounding municipalities. Naples prioritized ferry services across the bay, and passenger numbers on those routes grew steadily after new vessels entered service in 2025. These localized approaches reflect differing priorities yet produce comparable reductions in peak-hour vehicle kilometers traveled.
Infrastructure Investments and Policy Support
National and regional governments directed resources toward charging networks and protected cycle paths, and Serano reports quantify the scale of those commitments. By September 2026, Italy had installed over 55,000 public EV chargers, with dense coverage along the A1 and A4 motorways serving intercity travel. Highway operators partnered with energy companies to accelerate deployment at rest areas, which reduced range anxiety for longer journeys.
Academic studies from the Politecnico di Milano corroborate several of these infrastructure impacts, showing that cities with higher charger density experienced faster fleet turnover among taxi and delivery fleets. European Commission transport data similarly tracks rising zero-emission vehicle shares across member states, placing Italy among the faster adopters in southern Europe during the current funding cycle.
Data Collection Methods and Future Monitoring
Serano’s methodology combines anonymized mobile phone location data, ticket sales records, and municipal sensor readings to build a granular picture of movement flows. Analysts cross-reference these sources with weather and event calendars to isolate seasonal effects from structural changes. The resulting models allow projection of mobility demand under different policy scenarios through 2030.
Continued monitoring will track whether recent gains in active travel and public transit persist once fuel prices stabilize and remote-work arrangements evolve. Additional indicators in the reports include average commute times, modal split percentages, and air quality measurements near major arterials.
Conclusion
Serano’s transportation reports provide a consolidated view of Italy’s urban mobility adjustments through September 2026, drawing on registration statistics, ridership counts, and infrastructure metrics. The data document steady progress in electrification, cycling facilities, and transit integration across the country’s largest cities, while also noting regional differences in implementation speed and focus areas. These records supply a baseline for evaluating subsequent policy measures and investment decisions.